Selected work
Project examples
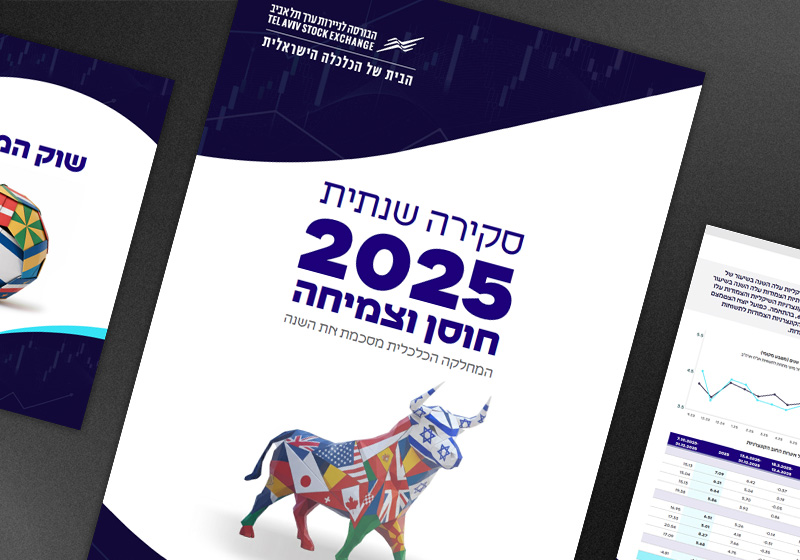
Annual Report
Tel-Aviv Stock Exchange 2025 Annual Report
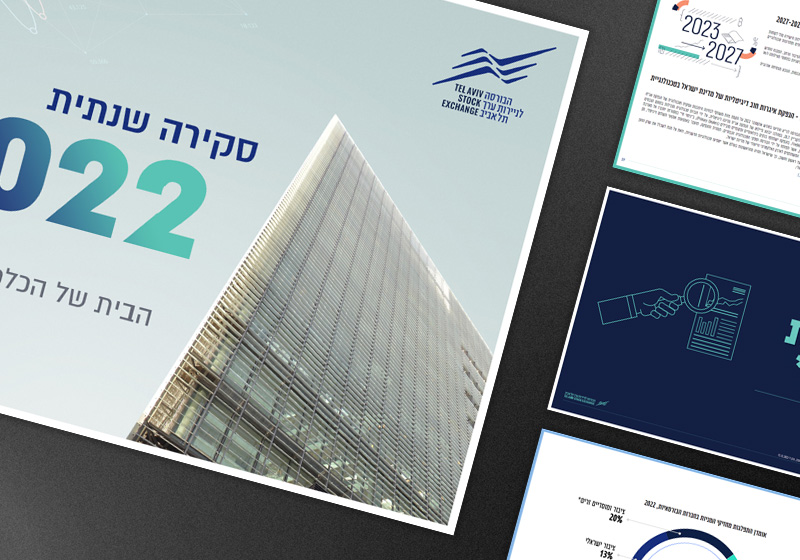
Annual Report
Tel-Aviv Stock Exchange 2022 Annual Report
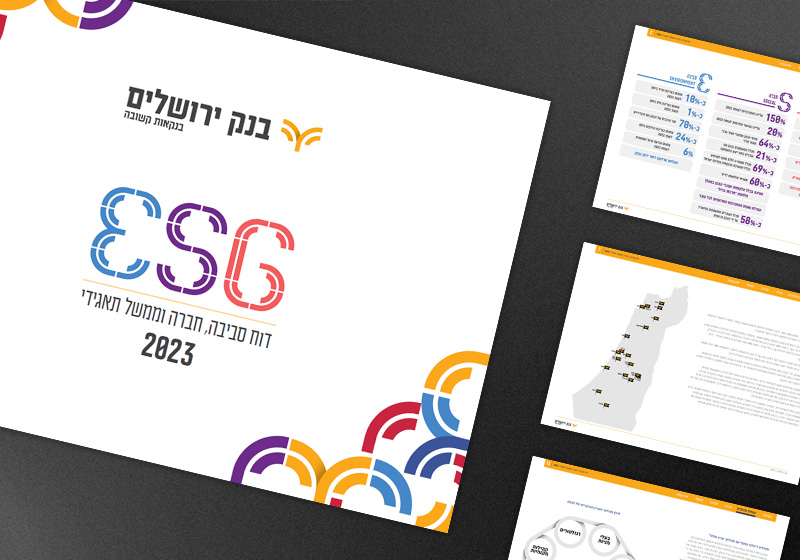
ESG Report
Jerusalem Bank 2023 ESG Report
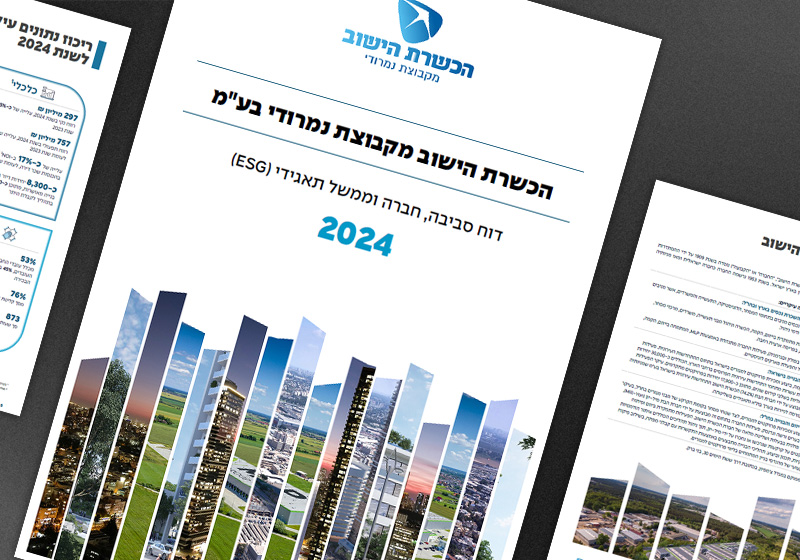
ESG Report
ILDC 2024 ESG Report
ESG Report
Mekorot 2024 ESG Report
ESG Report
Infinidat 2024 ESG Report
Financial Magazine
Tel-Aviv Stock Exchange Indices Magazine
Financial Market Report
Mivne Financial Market Presentation
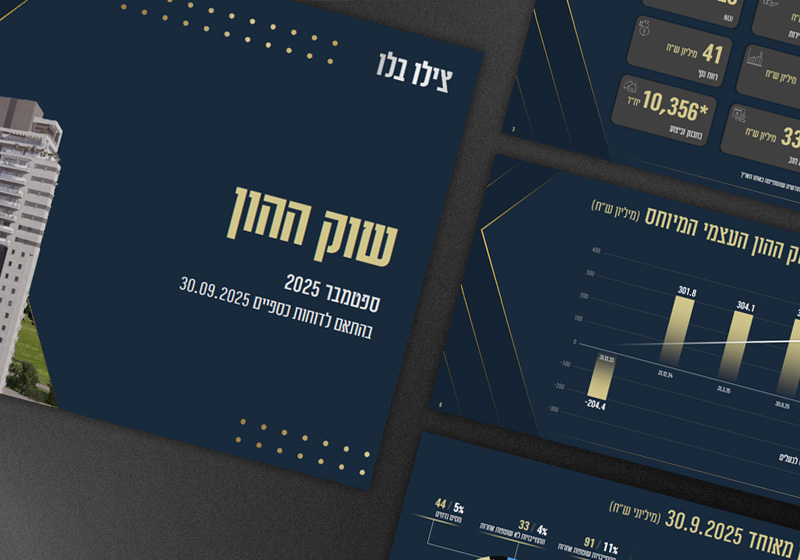
Financial Market Report
Cielo Belo Financial Market Presentation